04 Sept 2026
The Math Behind Burn Rate Detectors
9 min read
This article is my understanding of the Google SRE Workbook chapter on “Alerting on SLOs”.
I highly recommend reading it to get more examples!
SLOs and error budgets
An SLO, or Service Level Objective, is an internal target for a service to meet over a period of time. Common SLOs are used for service availability and latency SLOs, such as having a 5 nines uptime (99.999% availability).
When defining an SLO, you also (inherently) define an error budget: the number of errors that can occur within the period of time that stays within the SLO.
For instance, at an SLO of 99.9% (3 nines), the error budget is 0.1%. So if the service has 1,000,000 requests a month (which we can standardize as 30 days for simplicity),
the error budget is 1,000 errors in the entire month. This means that every day, you can have about
If we get 30 errors every day, we would have only gotten 900 errors, and we would have still met our SLO of a 99.9% availability.
Why error rates don’t scale well
Typically, most operational health metrics are based on the rate of errors that occur at a period of time, compared to the SLO. We call these error rate alerts.
These error rate alerts are very one-dimensional. They primarily focus on detecting regressions of your system at a point in time, and do not adapt well to the total traffic over time.
For instance, the error rate threshold for the availability of a service with an expected uptime of 99.9% might look like:
This alert could be configured with a lookback window of 15 minutes.
Then, take the following scenario where the total requests at a point in time is equivalent to the number of 500s:
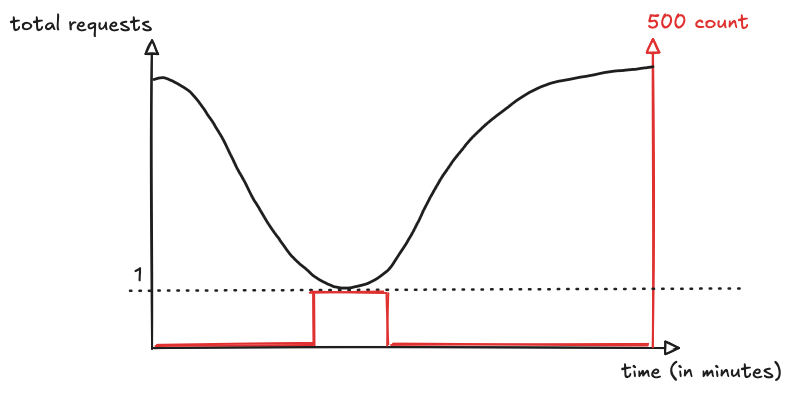
In this scenario, if we used an error rate alert, it might detect the increase in 500s over the lookback window, and it would compute the error rate at the point in time:
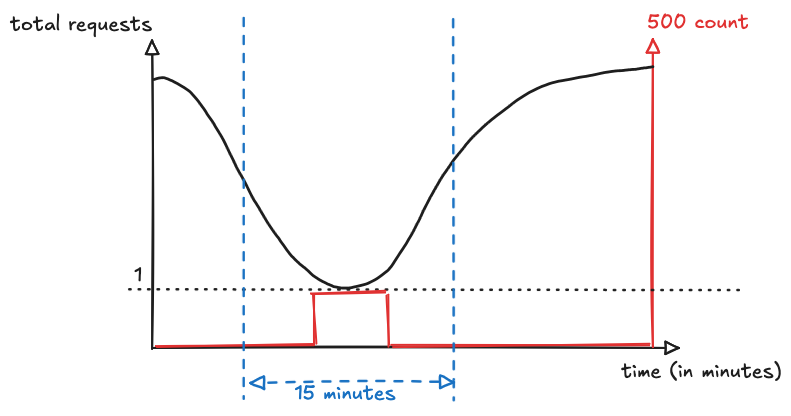
It would calculate something like:
- Number of 500s: 1
- Number of requests: 1
- Error rate: 100%
Given that the error rate is 100% and the error rate threshold is 0.1%, the alert would fire. But this is likely a false alarm, as there were no other recurrences of the errors across the rest of the service.
This is a problem because now the alert has a high false positive rate, creating alert fatigue for responders.
Why not increase the lookback window?
A very natural first instinct would be to say, “Why not increase the lookback window so it takes more errors to trigger the alert?”
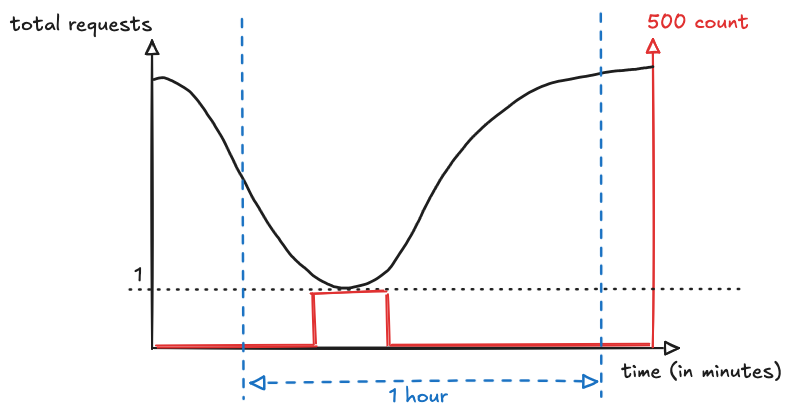
And this is absolutely spot on! In this scenario, suppose that the lookback window is increased to 1 hour instead (4x greater than the previous window):
Now, the calculations could look like (albeit rather exaggerated but point notwithstanding):
- Number of 500s: 1
- Number of requests: 500,000
- Error rate: 0.0002%
This time, the error rate is much less than the error rate threshold, so an alert doesn’t occur.
However, suppose that we took a step back and zoomed out, and realized that every hour, we were getting 1-3 errors (averaging 2 an hour).
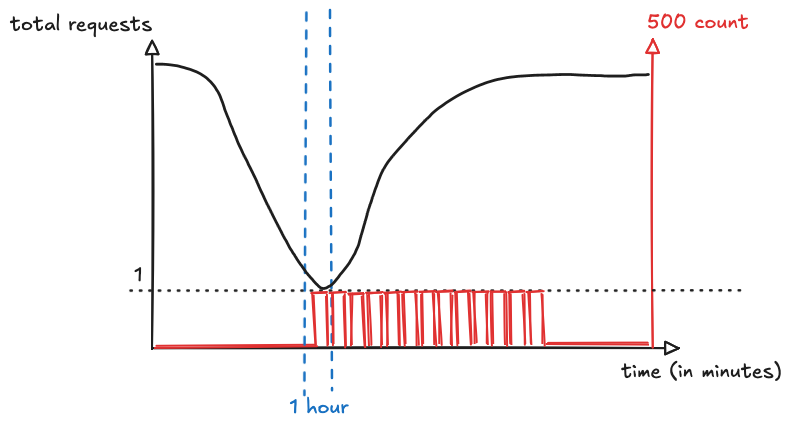
(Excuse my awful mouse drawing skills)
Individually, at each lookback window, none of these errors would raise an alert, but if this problem persisted throughout the day, it would have generated an average of 48 alerts in the day, above the error budget of 33.3 errors a day.
Now, we have a problem of false negatives where a clear issue is going unnoticed because our error rate alert is too loose.
What about enforcing that errors need to be firing for an extended duration?
Another great instinct!
And this is not the same as increasing the lookback window!
Increasing the lookback window is like saying, “I want to have a wider sampling window so that my error rate is less prone to one-off spikes”, which gives the error rate alert more “breathing room” to ingest more events - error and success - to avoid false positives.
Increasing the alerting duration is like saying, “I want the problem to last for a sustained duration”. For instance, the service might get bursts of 100% error rates that last for a minute. But a proper issue would be when these 100% error rates last for 10 minutes. In this case, the alert duration would be 10 minutes.
However, once again, a burst of 100% error rates that last for 5 minutes can then go un-alerted, creating another problem of false negatives.
So if we can’t really improve the false positive and negatives by using error rate alerts, what can we do?
It’s a bird, it’s a plane, it’s a burn rate detector!
Rather than modelling and focusing on the error rate, we should design alerts around how quickly they burn through the error budget.
If our error budget is 33.3 a day, a serious issue would chew through the budget in less time, which could mean that the problem is a slow-burning issue (where it is chewing through the budget consistently throughout half the day) OR a sudden spike (where it immediately chews through the budget).
To model the rate the error budget is burned, we can use the following:
| Burn rate | Error rate at 99.9% | Time to exhaust error budget |
|---|---|---|
| 1 | 0.1% | 30 days |
| 2 | 0.2% | 15 days |
| 10 | 1% | 3 days |
| 1000 | 100% | 43 minutes |
We start shifting our focus from “what are the errors happening at this moment?” to “are the error occurring at this moment going to burn through my error budget more quickly than expected?”
Then, we define our consumption threshold, which is the threshold that the burn rate exceeds that we deem necessary for alerting. Maybe we want to be alerted when 2% of our error budget is consumed, so the consumption threshold would be 2% of the error budget within the available lookback window.
With these, we can now define the actual burn rate detector and the alert threshold:
The SLO period is the entire month in this instance.
So, if we have a consumption % of 2% for a lookback window of 1 hour, we would have a consumption threshold of:
So if an issue is burning through our error budget at a rate that is 14.4 (or 1.44% error rate at 99.9% SLO) or greater, we deem it alert-worthy.
To illustrate this, we can reverse the question, asking ourselves, “How many errors need to occur in the 1 hour lookback window to have a burn rate of 14.4?”
Let’s constraint this problem by defining that the number of requests is 500,000 and SLO is still 99.9%:
This means that we would have to have 7,200 errors to trigger this alert. If this number seems too high, then lowering the consumption % would help to increase the sensitivity of the alert as well. For instance, we can lower the consumption % to 0.5% (so if 0.5% of our error budget is burned, we want to be alerted). This yields a total error count of 1,800 within the lookback window. You could also tighten the SLO so that the error budget decreases, for instance, keeping the consumption % at 2%, but tightening the SLO to 99.999% (5 nines), then the total error count would be 72 instead.
I highly recommend taking a pen and paper and trying these computations several times to build up an intuition for how each component influences the others.
Tiered burn rate detectors
We can also combine multiple burn rate detectors to create tiers of alerts, where each tier has a different alerting mechanisms (like creating Slack messages, opening tickets, paging, etc) associated with the rate of error consumption. These can be paired with different lookback windows as well:
| Consumption % | Lookback window | Alerting | Burn rate |
|---|---|---|---|
| 2% | 1 hour | Page | 14.4 |
| 5% | 6 hours | Page | 6 |
| 10% | 3 days | Ticket | 1 |
(These are the recommended thresholds from Google)
These create higher granularity alerts: the first alert detects sharp spikes in errors while the last alert detects slow-burn issues that don’t immediately impact the availability but still burn through the error budget.
Reducing false positives
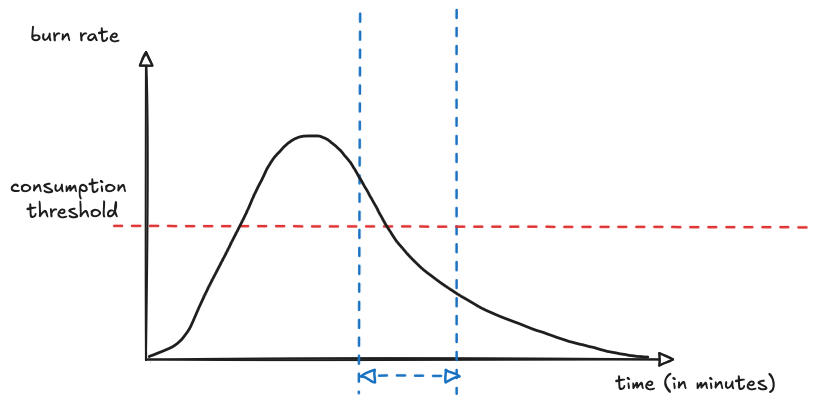
Even with burn rate detectors, false positives can be present: an issue could no longer be ongoing but its tail-end could still exist at the very start of the lookback window, triggering the burn rate detector:
To reduce the rate of false positives, we can introduce a second shorter window that answers the question, “Is this problem ongoing?”
According to the Google SRE Workbook, this shorter window should be 1/12th the length of the longer window:
| Lookback window | Shorter window |
|---|---|
| 1 hour | 5 minutes |
| 6 hours | 30 minutes |
| 3 days | 6 hours |
The consumption threshold is tied to the lookback window, and the shorter window inherits this same window, but its calculation uses the much shorter lookback.
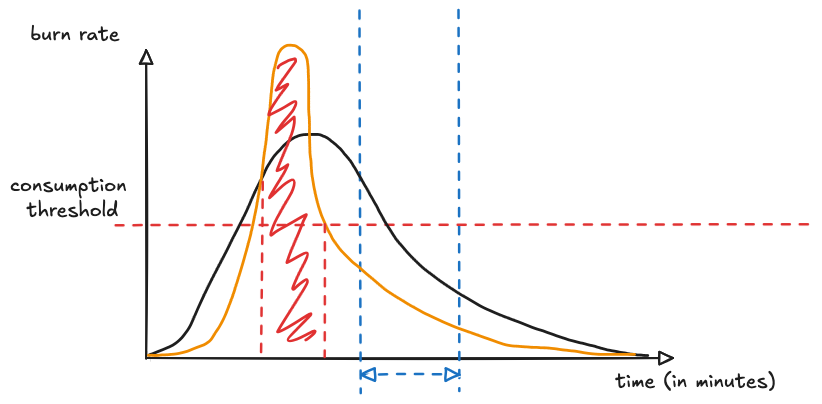
The shorter window will be much spikier than the longer window. We only alert when both the long and short windows exceed the consumption threshold at the same time (see the colored area). In the longer lookback window’s slice (in blue), the short window burn rate does not exceed the consumption threshold, so we do not alert.
In doing so, we only alert when we confirm that:
- There is a problem chewing through the SLO (long window)
- The problem is still ongoing (as opposed to having occurred in the past and is currently recovering) (short window)
Let’s run through a simple exercise to illustrate the point:
- Short window burn rate
- Errors in 5 minutes: 2,000
- Requests in 5 minutes: 10,000
- Burn rate: 200
- Long window burn rate
- Errors in 1 hour: 8,000
- Requests in 1 hour: 500,000
- Burn rate: 16
Both of these exceed the threshold of 14.4, so an alert fires. Now, when we shift the lookback window further:
- Short window burn rate
- Errors in 5 minutes: 100
- Requests in 5 minutes: 10,000
- Burn rate: 10
- Long window burn rate
- Errors in 1 hour: 7,500
- Requests in 1 hour: 500,000
- Burn rate: 15
In this scenario, even though the long window still contains the remnants of the errors, the short window does not capture it, so the alert does not fire.
Conclusion
I hope that this article was able to motivate the math behind burn rate detectors and how it solves problems that error rate alerts do not.
I have become a big proponent of favoring burn rate detectors over error rate alerts to develop golden signals for system health that error rate alerts simply could not provide.
Further reading
Enjoyed reading?
Consider subscribing to my RSS feed or reaching out to me through email!